Is your code full of print() calls like this?
func get_file_data(filepath):
	var file = File.new()
	var error = file.open(filepath, File.READ)

	print(error) # 1...
	var line_length = file.get_32()
	print(line_length) # 2...
	# ...
Wouldn’t it be great if you could pause your game anytime and inspect your values in context?
In this guide, you’ll learn how, using Godot’s debugger.
Accessing the debugger
You can open the debugger in two ways:
- By inserting breakpoints in your code in the script editor.
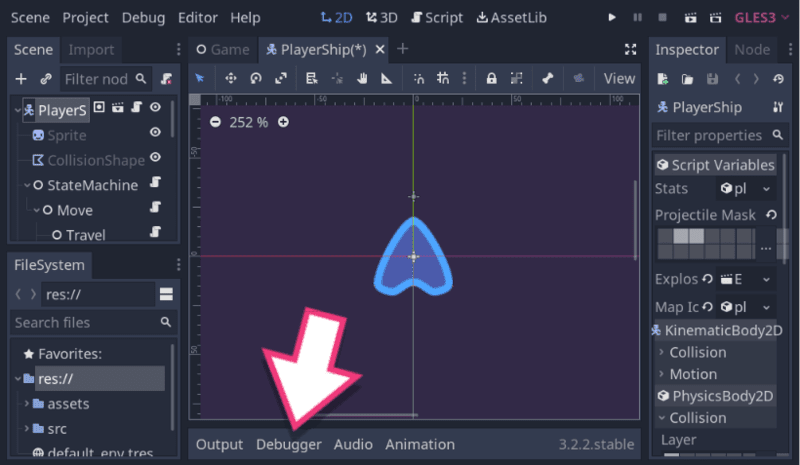
- By clicking on Debugger in the bottom panel.
Breakpoints
A breakpoint tells the client running the code to ask the debugger to pause the program’s execution and report to the programmer. In Godot, when you test your game, and the compiler reaches a breakpoint, the game pauses. At this point, the debugger panel displays some information. It tells you on which line the breakpoint happened, shows you a stack trace, and fills with information about the game’s current state.
To set breakpoints, open the script you want to debug, navigate to the line you want to break at, click in the left margin. You can press the F9 shortcut key instead. A red square represents the breakpoint. Click or press F9 again to remove it.
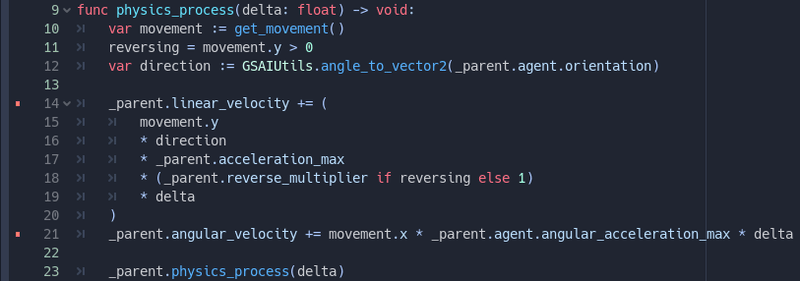
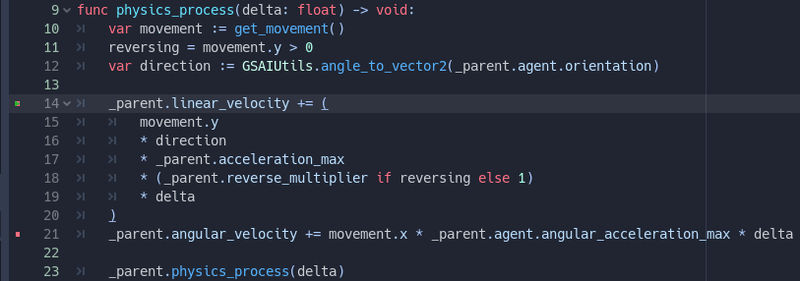
With breakpoints set, once you run your game, it executes until it reaches the line of code. The execution stops right before the line with the breakpoint. The script editor highlights the line and displays a little green arrow above the red square.
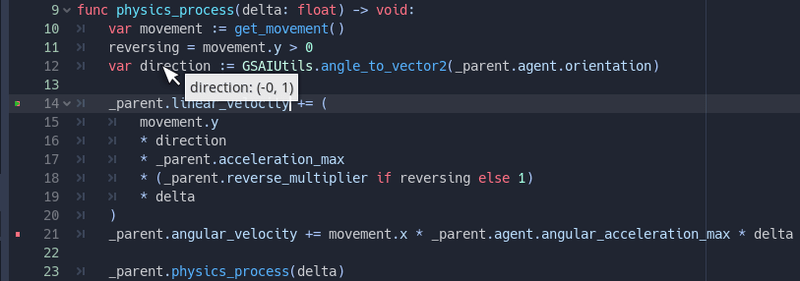
If you hover any variable you set before the breakpoint, a popup shows you its current value.
The ability to hover variables close to the breakpoint is nice, but you can get much more information from the Debugger panel.
The Debugger tab
In the top left of the Debugger tab, Godot lists why the program paused. If your code runs into an error, it shows the error text instead. For example, Division by Zero in operator '/'. When reaching a breakpoint or manually pausing execution, it displays Breakpoint instead.
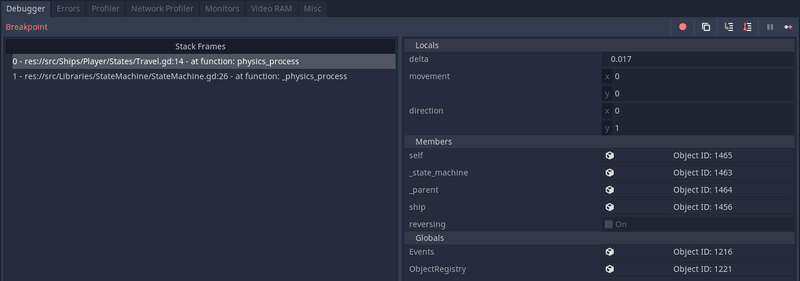
Below the red text, you can find the Stack Frames, also named the call stack. When the program pauses, it lists the lines of code that led to the current function. The function in which it paused is at the top. Its callers follow, stacking on top of each other, hence the name.
The compiler traces back to the initial caller and stops when it can’t dig any further. In Godot’s case, this happens when the C++ engine called the function. In the screenshot below, it’s the built-in _physics_process.

If you click on any element in the list, you can see the execution state of each of those function calls. It is useful when you want to know why you got certain parameters or which conditional block or for loop called the function.
In the bottom right, you can find the list of all variables the debugger can see in the current call stack frame and their values. Clicking on a different line in the Stack Frames switches those variables to the corresponding stack frame.
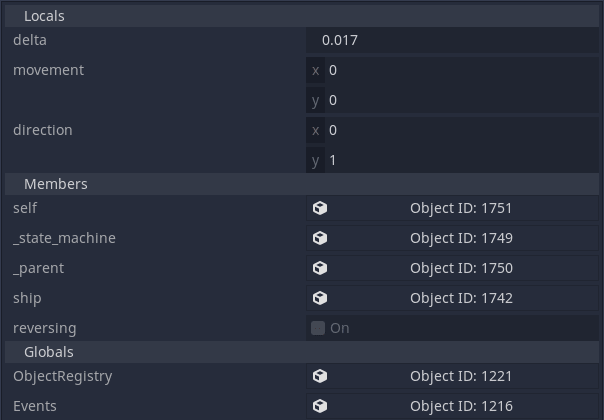
The variables area is split into three categories: locals, members, and globals.
- Locals are the variables defined in the current function.
- Members are variables that are part of the current class or classes it extends.
- Globals are variables accessible through Autolads, nodes that are accessible globally in the project.
Godot does not put variables from its built-in classes, like Node or Object, in this panel, so it doesn’t become crowded. But you can view those variables using the inspector.
Godot lists complex objects, like references to other Nodes, in the variables panel as buttons with the name Object ID: ####. The ID is an internal number the engine assigns objects to keep track of them.
When you click on a value, its complete state displays in the Inspector, even properties from built-in types like Node. Every class has a member variable called self to refer to the current class. If you want to see the position of a class that extends Node2D, you can use the self button in the Members category to put it in the inspector.
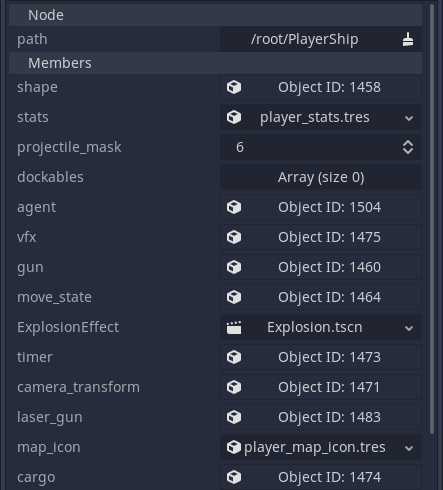
You can click on more Object ID reference buttons in the inspector and keep drilling deeper into the game’s memory until you find what you need.
It’s not debugger specific, but the inspector’s navigation buttons in the top-right also work when debugging.
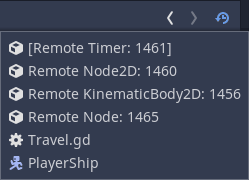
Navigating through live code with the toolbar
The final element of the debugger panel is its toolbar in the top-right. These buttons control the program’s execution, allowing you to continue the execution or step over the code line-by-line.
![]()
The leftmost button is Skip Breakpoints. It makes the debugger ignore breakpoints temporarily without removing them from your code. The button next to it allows you to copy errors. If you get an exception, you clicking this button allows you to copy a lot of information, including the code backtrace in text format. You can use it when reporting a bug on an open-source Godot project.
The next group of buttons are for code navigation. You have the Step Into and the Step Over buttons. Take the following code as a example, with a breakpoint set at the var movement := get_movement() line:
func _physics_process(delta: float) -> void:
	var movement := get_movement() #--Breakpoint here
	move_and_slide(movement * speed, Vector2.UP)


func get_movement() -> Vector2:
	return Vector2(
		Input.get_action_strength("right") - Input.get_action_strength("left"),
		Input.get_action_strength("thrust_back") - Input.get_action_strength("thrust_forwards")
	)
If you click the Step Into button, or press the shortcut key F11, the compiler will step into the get_movement() function and pause on its first line.
If you click the Step Over button, or press the shortcut key F10, the compiler executes the get_movement() function and pauses on the next line after its end. In this case, it is the call to move_and_slide().
Next to those is the Break button. It’s greyed out when you are actively debugging, but if the game is running without breakpoints and you want to stop execution, you can click this button anytime. It does the same thing as the Pause Scene button in the top right (shortcut key F7). There will not be any stack frame or variable data if you do so since this button triggers a pause inside C++ code. But you can still use it to look at the state of the game or inspect the remote scene tree..
The last button on the right is the Continue button. Clicking it or pressing F12 resumes the game’s execution until the next breakpoint.
The remote scene tree
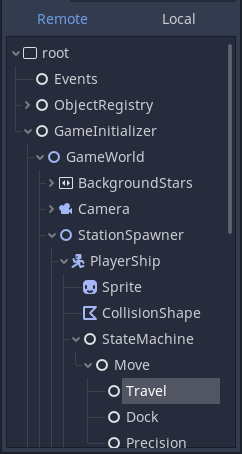
When the game is running, a tab named Remote appears above the scene tree. It displays a snapshot of the node tree at runtime, as seen from the engine. It starts from the root viewport and contains every instanced node.
You can select any node and see its state in the Inspector, just like in the debugger’s variables area.
And that’s it. You now know more than enough to get started debugging your projects. You don’t have any excuse to litter your code with print() statements anymore!
If you’d like to support our work, we are on Kickstarter to crowdfund Godot 2D Secrets, a comprehensive course to help you level up your game creation skills. All the details are on the Kickstarter campaign page.
Made by
Our tutorials are the result of careful teamwork to ensure we produce high quality content. The following team members worked on this one:
Senior Developer
Founder
