How to use Godot's built-in debugger
2026/08/18
- Type
- Learning Resource
- Format
- Study Guide
- Version
- Godot 4.x
- Code
- MIT
- Game Assets
- CC BY-NC-SA
- All else
- 2016-2026, GDQuest© - All rights reserved
- Created
- Updated
- 2020/08/17
- 2026/08/18
As you work on a game or any program, you will inevitably introduce bugs. That's when the game is not behaving as intended. It could be that the code has an error or that it does not produce the result that you wanted.
When that happens, you have to debug. Debugging is the process of investigating and fixing problems in your code, and for that, you need to find out what the game is actually doing. An important part of debugging is seeing the values stored in the computer's memory while the game runs.
You've probably already used the print() function to display a value in Godot's Output panel:
func _ready() -> void:
	var score := 0
	print(score)
This outputs the value of the score variable, which is "0".
The print() function works for small and quick checks, but it only shows the values at the specific points where you call print(). What if you want to check the value of a variable every step of the way? You have to call the print() function for every value you want to inspect:
func update_movement(delta: float) -> void:
	var direction := Input.get_vector(
		"move_left", "move_right", "move_up", "move_down"
	)
	print("direction: ", direction)

	const RUN_SPEED := 500.0
	var desired_velocity := direction * RUN_SPEED
	print("desired_velocity: ", desired_velocity)

	const ACCELERATION := 2000.0
	velocity = velocity.move_toward(desired_velocity, ACCELERATION * delta)
	print("velocity: ", velocity)

	move_and_slide()
What if I told you there's a better way? You can get more information by pausing the game and using Godot's built-in debugger to inspect every line of code and every property in memory as the code runs.
In the following clip, I tell Godot to pause the game on a specific line of code and let me inspect its variables in the Godot editor:
In this guide, you will learn how to use Godot's debugger. You will learn how to:
The debugger is a tool that lets you inspect the state of your program while it is running. Normally, Godot runs your code constantly and produces many frames per second so you can play the game.
Using the debugger, you can pause the game's execution on a specific line of code. Godot then shows you what the program is doing at that exact moment. You can inspect values, see which functions called each other, and move through the code one line at a time.
The debugger helps you answer questions like:
When an error occurs and Godot takes focus back from the game window, a lot of beginners think their game crashed. But it did not!
That's actually the debugger pausing the game so you can inspect the error and the state of the program. You can press F12 on your keyboard or click Continue to resume the game's execution.
This is what it looks like when you have an error:
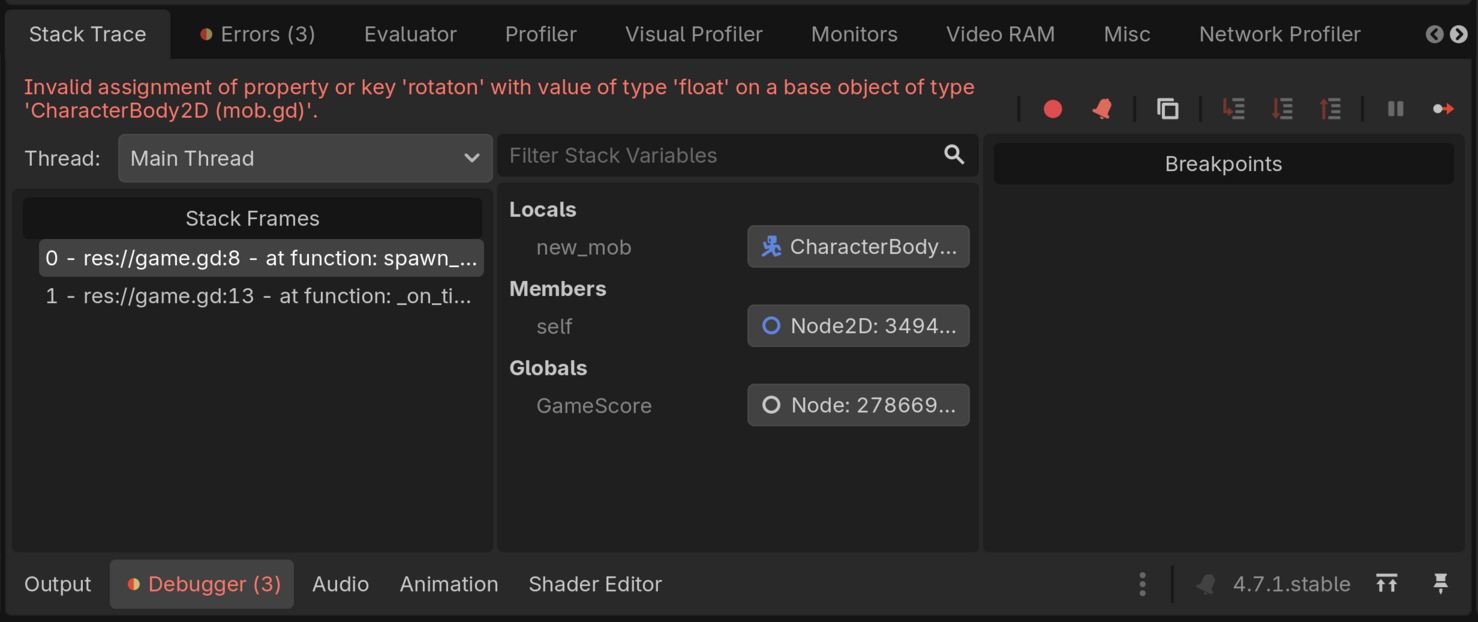
Godot highlights the line of code where the problem occurred in the script editor and opens the debugger bottom panel. The panel shows you:
You can use the debugger to troubleshoot errors when they occur, but you do not need to wait for an error to appear! By inserting breakpoints, you can tell Godot to pause just like when there is an error in your code.
A breakpoint tells Godot to pause the game when it is about to run a specific line of code. This brings up the debugger bottom panel and gives you access to all the debugger features.
To set a breakpoint, open the script you want to debug and click in the margin at the left of the line where you want the game to pause. You can also move the caret to the line and press F9. This shows a circle that represents the breakpoint. Click the circle or press F9 again to remove it.
Once you've set one or more breakpoints, run the game and play until Godot runs the line of code with the breakpoint. Godot will pause right before running that line of code. It then switches back to the script editor, which highlights the line of code and displays an arrow over the breakpoint icon.
When the game is paused by the debugger, you can resume its execution until the next breakpoint by pressing F12. You can also step through the code line by line using F11. It executes the next line and pauses the game again.
A quick extra tip: you can use breakpoints to check if the code in conditional branches runs at all. Insert breakpoints inside if or else blocks and play the game trying to get the code in specific conditions to run. If the breakpoint is never hit, it means the code is never running!
I often use breakpoints to simply verify that code is running at all when it's not working as intended.
Now that you know how to pause the game, let's look at how to inspect the program's state in the debugger.
As we saw, the debugger lets you pause and inspect the state of your game. But how do you do that exactly? When the game is paused, the Debugger bottom panel expands and gives you three types of information:
The stack frames list (also called the call stack) shows all the functions that led to running the current line of code. At the top of the list, you have the function where the code is currently paused. And as you click on functions down the list, you jump through the sequence of parent functions that called the current function.
When you click the different functions in the list, you can inspect all the arguments and state of those functions, which is useful to find out if a function passed invalid arguments or how your code called the current function.
This state is listed in the panel to the right of the stack frames list: the "Stack Variables" panel.
Function calls in a programming language use a data structure called a stack. When the computer calls a function, it keeps track of the current function for error reporting purposes and to know where to resume code execution when it completes the current function.
The computer literally stacks the information about the sequence of called functions in a pile where the last added entry is the currently running function. When it reaches the end of the current function, it removes it from the stack.
It's a data structure where you only stack a new item at the top of the pile or remove one from the top of the pile.
The data added at the top of the pile is also called a frame, but it doesn't have the same meaning as the game rendering a frame. It's rather a snapshot of the current function call, including the arguments used to call the function and any local variables.
There are three groups of variables listed in the Stack Variables panel: locals, members, and globals.
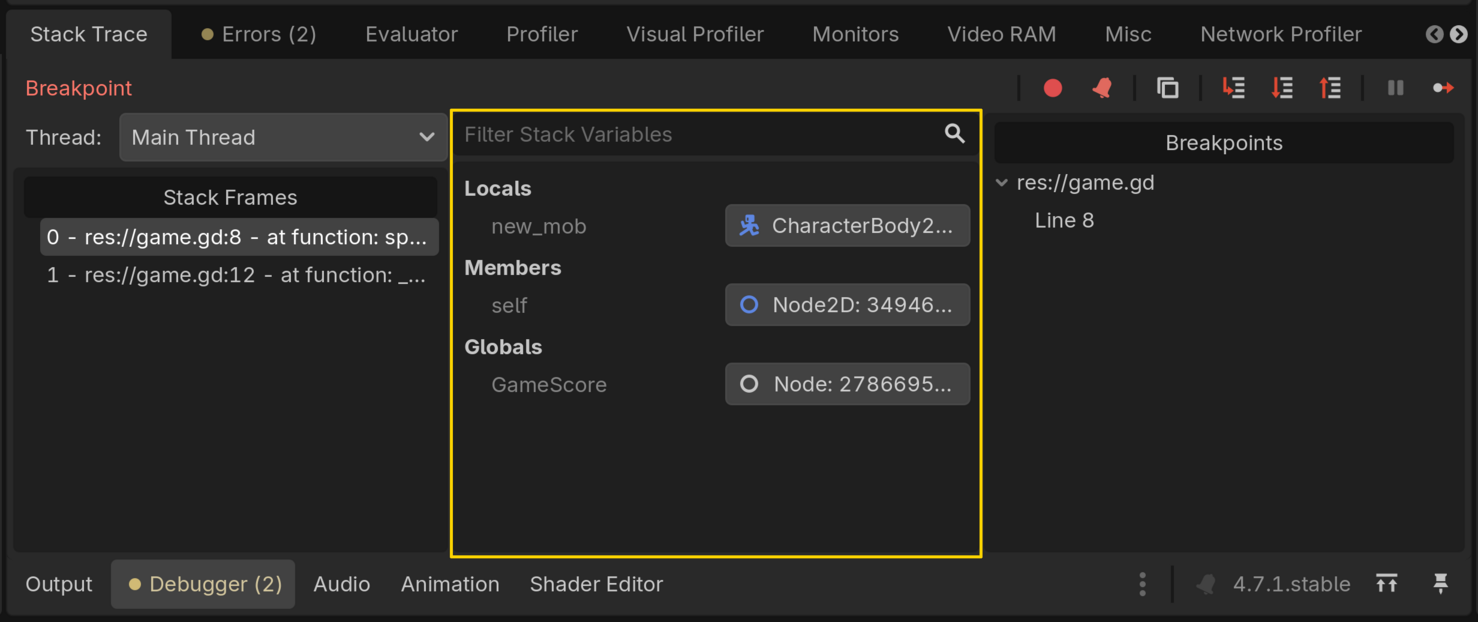
Local variables are all the variables declared in the current scope up until the current line of code, including the current function's arguments.
Members are all the member variables of the current object, also called properties. The member variable named self represents the current object, and clicking on the highlighted slot next to the label reveals all of the object's current values in the inspector. This means that you can use the same search, documentation on hover, and folding that you are used to in the Inspector dock.
Globals list all the autoloads in your project. You can click any of the slots the same way you would with member variables to reveal and interact with all the values in the Inspector.
You can change values in the Inspector if you want, and doing so changes the actual state of the running game for this run.
While the game is paused, you can also hover over any variable in the script editor that ran before the current line to preview its current value. This works with any variable, including function arguments or properties at the top of the script.
It's really convenient as you can inspect values right there in your code.
When you get an error or you hit a breakpoint, as I've mentioned before, your game has not crashed. Godot has just paused the game. The Debugger bottom panel comes with a toolbar that lets you control the code's execution. It lets you unpause the game or step through the lines of code.
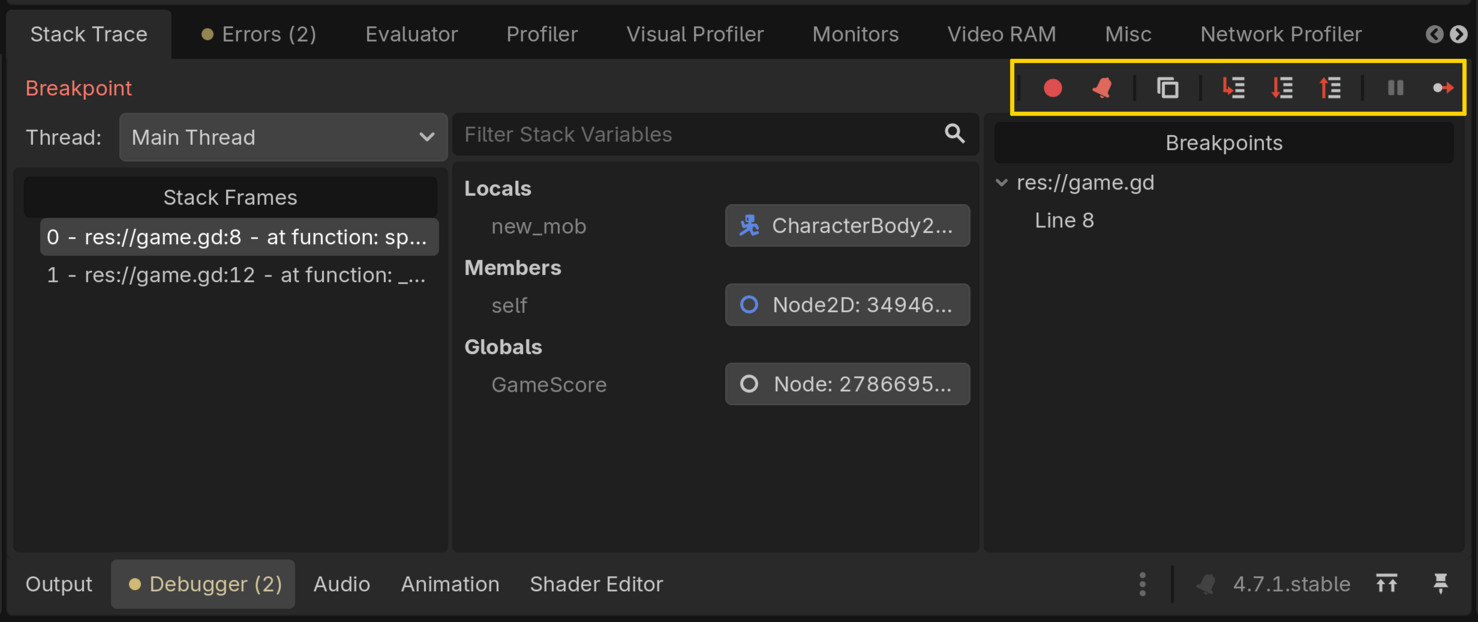
There are four controls for you to use:
You can also temporarily disable breakpoints by toggling Skip Breakpoints and disable pausing the game on errors by toggling Ignore Error Breaks (the bell icon should be red).
Yes, Godot supports the Debugger Adapter Protocol (DAP), which allows external editors to connect with Godot's internal debugger. You can configure the debugger in VSCode, Zed, and other code editors to work with Godot.
Look at the documentation of your editor's Godot support extension for information on how to get started.
Your ability to read and understand errors, debug your code, and implement mechanics on your own is part of the core skills you need to become independent and not depend on tutorials.
In Module 6 of Learn 2D Gamedev From Zero, you learn to use Godot's debugging tools to implement your first mechanics on your own. By Module 10, you're familiar with debugging your code and can combine your new skills to create an entire game by yourself without step-by-step tutorials.
Don't stop here. Step-by-step tutorials are fun but they only take you so far.
Try one of our proven study programs to become an independent Gamedev truly capable of realizing the games you’ve always wanted to make.


Get help from peers and pros on GDQuest's Discord server!
20,000 membersJoin ServerThere are multiple ways you can join our effort to create free and open source gamedev resources that are accessible to everyone!
Sponsor this library by learning gamedev with us onGDSchool
Learn MoreImprove and build on assets or suggest edits onGithub
Contributeshare this page and talk about GDQUest onRedditYoutubeTwitter…
Site in BETA!found a bug?